
Monitoring Scope
Checkmk covers a wide monitoring footprint, tracking infrastructure, networks, applications, containers and cloud services from a single platform. It offers deep host and service checks through its large catalogue of monitoring plugins, letting you observe hardware health, databases, storage systems, virtualisation layers and custom applications. It collects detailed metrics at short intervals and correlates status changes across systems to highlight emerging issues. Its hybrid design supports both agent based and agentless monitoring, giving flexibility across data centers, on premises setups and distributed environments.
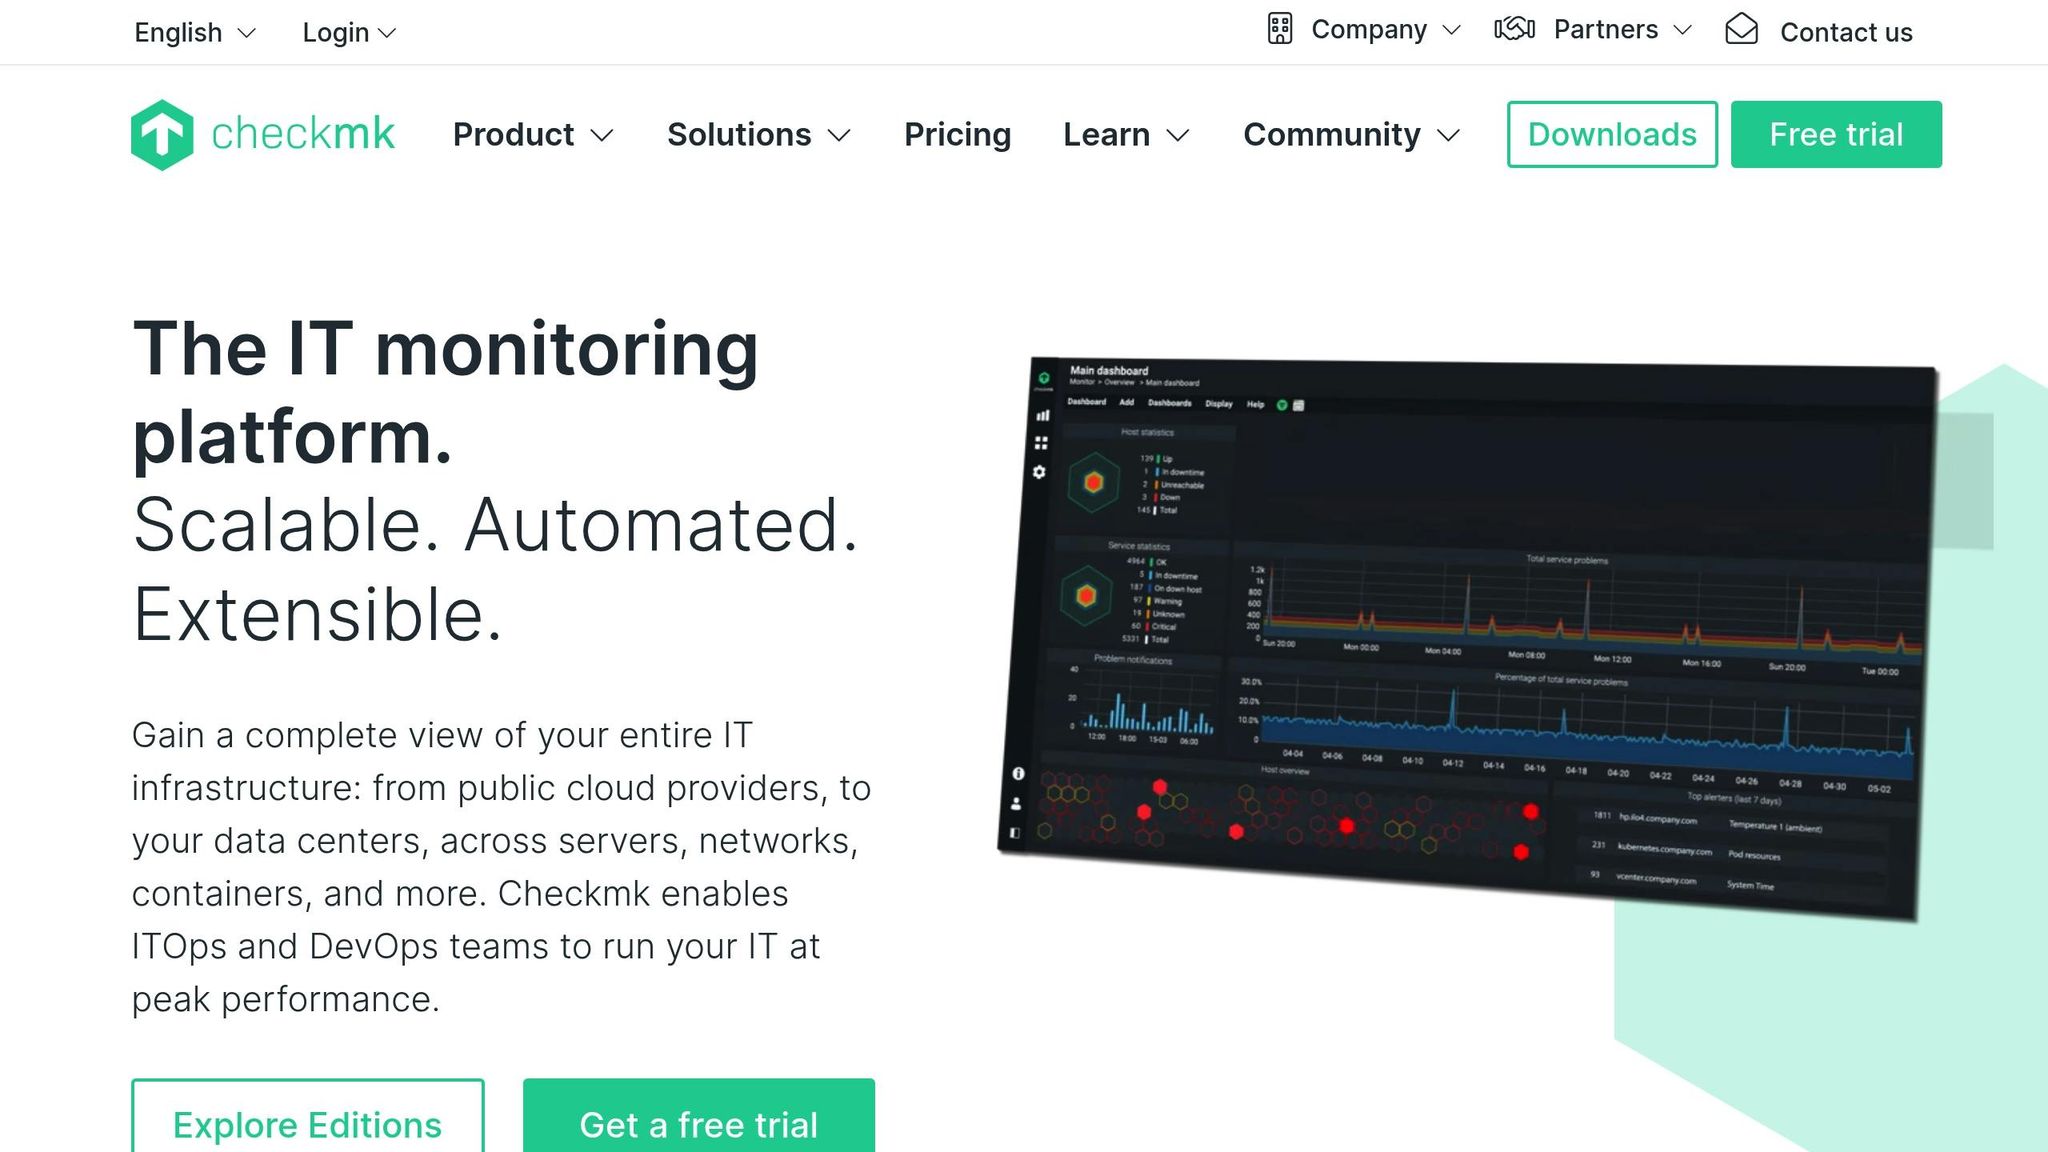
Real-Time Capabilities
Checkmk provides live dashboards that update continuously, showing host states, service checks and performance metrics as they change. It supports fast polling for critical hosts and can display real time graphs for load, memory, network and application health. Dashboards are customisable, so teams can highlight priority systems and surface urgent problems quickly. Its efficient monitoring core keeps overhead low even with thousands of checks per minute, allowing large setups to maintain responsive real time visibility.
AI and Automation Features
Checkmk includes automated threshold tuning and smart rule processing that reduce alert fatigue by adapting to baseline behaviour. It can discover hosts and services automatically and apply predefined monitoring rules without manual configuration. Predictive functions support trend analysis and capacity planning, helping teams spot saturation risks early. For complex environments, its rule based automation system streamlines configuration updates, check activation and notification logic. Deeper AI features usually require pairing with external analytics tools, since Checkmk focuses on deterministic monitoring rather than full incident automation.
Ease of Deployment
Checkmk is simple to deploy with a fast installation process and clear setup guides. The raw edition uses open source components, while the enterprise edition includes a refined UI and performance enhancements. Agents can be installed with a small script, and auto discovery detects new services immediately. It integrates well with virtualised and containerised environments, and it scales easily through distributed monitoring sites for large or multi region deployments. Because it offers strong defaults out of the box, teams can get a full monitoring system running quickly without extensive tuning.
Pricing
Checkmk provides a free raw edition that includes core monitoring, dashboards and alerting, making it suitable for small teams or lab environments. The enterprise edition adds advanced features such as better performance, extended automation, predictive analytics and long term reporting. Pricing for the enterprise edition is typically based on the number of monitored hosts, starting at an accessible entry tier and scaling for larger infrastructures. This keeps overall costs predictable and appealing for organisations that want a powerful monitoring system without high SaaS style usage fees.