How to Measure Latency Across Global Networks
8 min read - October 6, 2025

Learn how to effectively analyze IP transit traffic using NetFlow for improved network performance, security, and cost management.
How to Measure Latency Across Global Networks
Network latency measures the delay between data transfer points in a network and is crucial for applications like video calls, gaming, and financial trading. High latency can harm performance, user experience, and business operations. Here's how you can measure and manage it effectively:
- Tools to Use: Start with simple tools like Ping for basic diagnostics or Traceroute to map data routes. For advanced insights, use Netperf/iPerf or synthetic monitoring platforms.
- Setup: Deploy monitoring agents in key global locations to reflect real-world conditions. Use services like FDC Servers' infrastructure for broad coverage.
- Best Practices: Establish baseline measurements to identify normal performance and deviations. Combine latency data with metrics like jitter and packet loss for deeper analysis.
Effective latency management ensures smooth operations for cloud services, streaming platforms, and real-time applications. By using the right tools and strategies, you can minimize delays and maintain optimal performance.
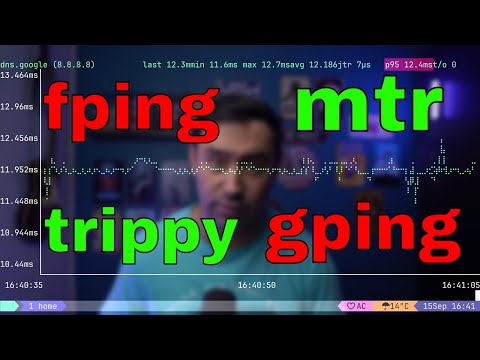
Networking Tools - Part #1 (fping, gping, mtr, trippy)
Prerequisites for Accurate Latency Measurement
To measure latency effectively, you need a dependable setup of network endpoints.
Reliable Network Endpoints
Your testing endpoints should be strategically placed across key global locations, including major offices, to reflect the actual network conditions your users experience. For instance, using the globally distributed infrastructure of FDC Servers (https://fdcservers.net) - which provides access to over 70 locations worldwide - can help ensure thorough and precise latency evaluations. Setting up these endpoints is a critical first step toward accurate measurement.
Methods for Measuring Latency
Once your endpoints are set up, the next step is figuring out latency. Here are some key ways to measure it:
Ping and Traceroute
Using Ping is one of the simplest methods. It sends ICMP Echo Requests to a target and measures the time it takes for a response to return. For example, running ping google.com will show response times in milliseconds. Testing from different locations can highlight how distance and routing affect latency.
Traceroute, on the other hand, maps the route your data takes through the network. It works by sending packets with gradually increasing TTL (Time to Live) values, identifying each router along the way and measuring the latency at each hop. On Windows, the command is tracert, while Linux and macOS users can use traceroute.
Synthetic Network Performance Monitoring
Synthetic monitoring involves using automated agents to simulate user actions. These agents run scripts that test interactions and proactively measure latency, giving you insights before real users are impacted.
Selecting the Right Latency Measurement Tools
Once you’ve mastered the basics of latency measurement, the next step is picking the right tool for the job. The tool you choose can make or break your analysis - selecting the wrong one could leave you with incomplete data or wasted time and resources.
Comparison of Common Tools
Not all tools are created equal, and understanding their strengths and limitations is key to making an informed decision. Let’s break down some popular options:
- Ping: Ideal for quick diagnostics, ping is simple and easy to use. However, it’s not suited for in-depth monitoring or detailed analysis.
- Traceroute: Great for pinpointing routing issues, traceroute can map the path data takes across the network. But like ping, it lacks continuous monitoring capabilities.
- Netperf and iPerf: These tools take things up a notch, offering advanced testing that includes both latency and bandwidth metrics. They can simulate traffic patterns for a more detailed performance analysis, but they require more setup and technical know-how.
- Synthetic monitoring platforms: These are designed for automated, global testing. They often include dashboards, alerts, and historical data analysis, making them powerful but also more expensive and complex to deploy compared to basic tools.
Here’s a quick comparison to help you weigh your options:
Use this table as a guide to narrow down your choices based on your specific requirements.
Criteria for Tool Selection
When choosing a latency measurement tool, keep these factors in mind:
- Scalability: Can the tool grow with your needs? Whether you’re monitoring a handful of endpoints or a global network, you’ll want a solution that doesn’t require constant replacement as your infrastructure expands.
- Integration: If you’re already using monitoring systems, look for tools that can easily export data or connect to platforms like Grafana. Built-in API support can also simplify custom integrations and automate reporting.
- Geographic Coverage: Tools that come with pre-deployed global agents or simplify manual deployment are a big plus. If you need region-specific data, ensure the tool can provide measurements from those locations.
- Metric Detail: Depending on your needs, you might only require basic round-trip time measurements, or you might need more in-depth metrics like jitter, packet loss, or segment delays. Choose a tool that aligns with the level of detail you need.
- Cost: Consider both the upfront and ongoing costs. Free tools save money but may demand more manual effort, while paid solutions often reduce workload with automated features but come with subscription fees. Be sure to account for the total cost of ownership, including maintenance and analysis.
- Reliability and Accuracy: Tools that handle time synchronization automatically can improve accuracy, especially when dealing with network congestion. Look for solutions that provide consistent and statistically reliable data.
- Team Expertise: Simpler tools like ping require minimal training, while advanced platforms may need dedicated staff for setup and maintenance. Match the tool’s complexity to your team’s skill level and resources.
Best Practices for Monitoring and Analyzing Latency
Measuring latency accurately is just the beginning. The true value lies in adopting smart monitoring practices that transform raw data into actionable insights. These strategies can help you create a reliable system for identifying latency issues before they affect your users.
Deploy Agents in Key Locations
Strategically placing monitoring agents in critical network locations gives you a clearer view of the end-to-end user experience. Start by identifying regions with high user activity and deploy agents in major cities to ensure broad geographic coverage.
Position agents at edge locations to monitor end-to-end performance effectively. For instance, businesses using FDC Servers' global network - which spans over 70 locations - can deploy agents at both origin servers and key distribution points to capture the full delivery chain.
To capture diverse performance data, deploy agents across various network types, including ISPs, cloud environments, and mobile networks. Add redundancy by installing multiple agents in high-priority regions, ensuring continuous visibility even if one monitoring point goes offline. Once agents are in place, establish regular measurement routines to quickly spot deviations from normal performance.
Regular Baseline Measurements
After deploying agents, it’s crucial to establish a baseline for network performance. Consistently benchmarking performance helps you distinguish routine fluctuations from genuine anomalies. By gathering historical latency data over a representative period, you can identify patterns in network behavior and define what "normal" looks like.
A solid baseline sets acceptable latency ranges by defining upper and lower thresholds. Any deviation outside these boundaries could signal underlying issues that require attention. For example, a sustained rise in latency might indicate congestion or other problems.
As your network evolves - with new infrastructure, routing changes, or shifting traffic patterns - regularly updating your baseline ensures it reflects current conditions. Factoring in seasonal variations, such as predictable high-traffic periods, can also help you avoid unnecessary alerts.
Correlating Metrics for Complete Analysis
Latency is just one piece of the network performance puzzle. To get a full picture, you need to correlate latency with other metrics like bandwidth usage, packet loss, and jitter. This combined analysis can help you pinpoint the root causes of delays.
For example, stable latency with low jitter suggests consistent network performance, while high jitter alongside latency spikes points to instability. By analyzing when and where latency spikes occur, you can uncover specific issues. Simultaneous spikes across multiple paths may indicate upstream problems, while localized increases can highlight regional challenges.
Integrating these correlated metrics into your monitoring dashboards allows you to spot patterns more effectively, enabling smarter decisions to improve network performance.
Conclusion
Measuring latency across global networks is a key factor in delivering smooth user experiences and staying ahead in a competitive landscape. From simple diagnostic tools to advanced synthetic monitoring solutions, each option plays a unique role in crafting an effective strategy for latency measurement.
By combining these tools strategically, organizations can achieve a well-rounded approach. Quick tools like ping and traceroute are great for basic diagnostics, while more advanced options like Netperf and iPerf provide deeper, more detailed insights. Taking it a step further, modern synthetic monitoring platforms offer near real-time visibility into network performance, enabling proactive decision-making.
Strategic placement of monitoring infrastructure is crucial for accurate results. Deploying monitoring agents in key global locations allows organizations to uncover regional performance issues and make smarter routing decisions. Using globally distributed hosting providers, such as FDC Servers, helps position monitoring closer to end users, ensuring a more accurate view of their experience.
To turn latency data into actionable insights, it’s essential to correlate it with other network metrics like bandwidth utilization, packet loss, and jitter. This approach helps distinguish routine variations from critical problems, providing a solid foundation for optimizing network performance.
Finally, consistent baseline measurements are vital. They act as benchmarks, helping to identify deviations quickly. Regularly updating these baselines ensures that your monitoring strategy keeps pace with changes in your network infrastructure and traffic patterns.
FAQs
Why are synthetic monitoring platforms better than basic tools like Ping and Traceroute for measuring network latency?
Synthetic monitoring platforms take network latency measurement to the next level, going beyond basic tools like Ping and Traceroute. By simulating actual user traffic, these platforms provide continuous monitoring of network performance, helping to identify potential problems before they affect users.
While Ping and Traceroute offer straightforward, reactive metrics, synthetic monitoring delivers a more comprehensive view. It can assess the entire network, pinpoint the root causes of latency, and even confirm compliance with service-level agreements (SLAs). This makes it a powerful option for obtaining precise, real-time performance data across global networks.
How can I make sure my latency measurements reflect real-world network conditions across the globe?
To get latency measurements that mirror actual conditions, combine active tools like ping and traceroute with passive monitoring techniques, such as analyzing traffic or using mirrored sessions. Place test points across different geographic regions and align testing intervals to account for global variations.
Take into account elements like local network performance, intermediate hops, and time zone differences. Regularly fine-tune your tools and compare results to real user experiences. This method offers a clearer perspective on global network performance.
What are the key signs that it's time to update your baseline latency measurements, and how often should this be done?
If you're noticing consistent delays, unexpected spikes, or irregular patterns in latency, it might be time to revisit your baseline latency measurements. These issues often signal shifts in network performance that shouldn't be ignored. Similarly, major events like hardware upgrades, changes to network topology, or significant increases in traffic are clear signs that your baseline needs an update.
To keep your performance monitoring accurate, aim to review and adjust your baseline every 3 to 6 months. Additionally, make it a priority to update immediately after any major network changes. Regular updates help ensure your monitoring reflects the current state of your network.

iperf3 Tutorial: Test Network Speed on Linux & Windows
Install iperf3, run bandwidth tests, and tune TCP buffers for accurate results on Linux and Windows. Covers UDP, bidirectional, and 10GbE+ testing
10 min read - May 7, 2026

Have questions or need a custom solution?
Flexible options
Global reach
Instant deployment
Flexible options
Global reach
Instant deployment